 sarah-anjani
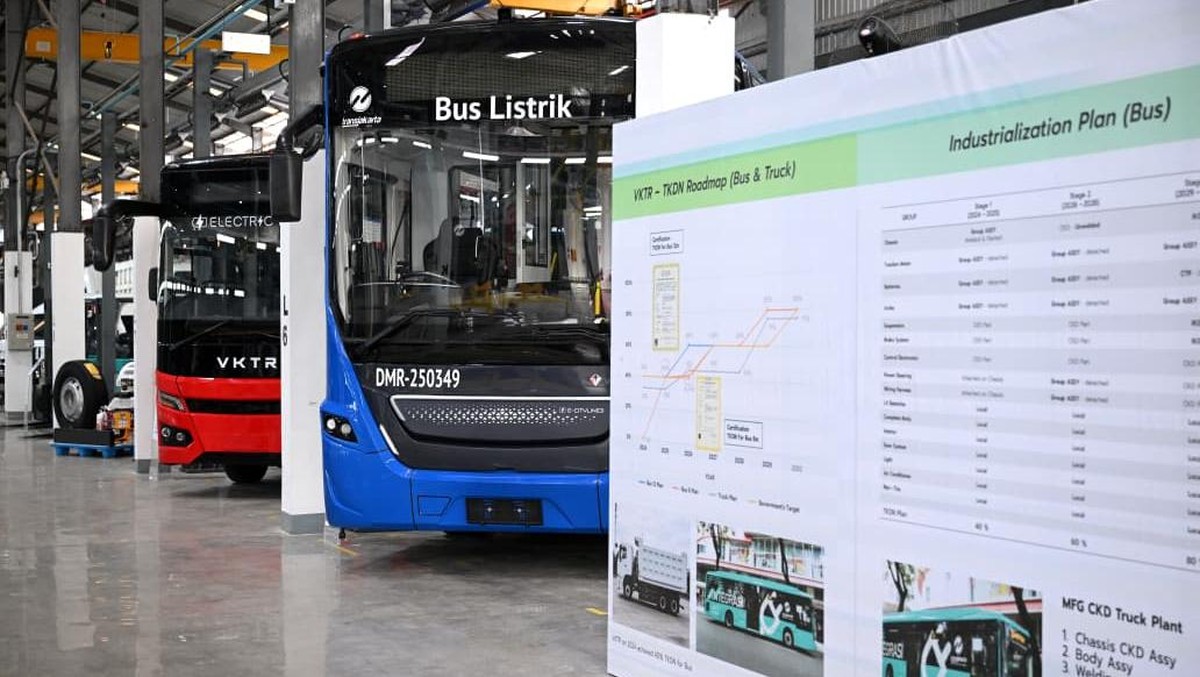
Berdasarkan data Institute Statistik Indonesia (BPS) dan catatan '_ mengenaiBased on data from the Central Bureau of Statistics (BPS) and Bank Indonesia's most recent policy documents, the growth of electric-bus manufacturers in Indonesia is moving in tandem with the national energy-transition agenda. In the first semester of 2026, one of the main names in the electric-bus and electric-vehicle industry, PT VKTR Teknologi Mobilitas Tbk (VKTR), recorded net revenue of Rp648 billion. Against the same semester a year earlier, that figure grew 56% year-on-year. At roughly Rp415 billion, the prior-year base explains how quickly the scale of the business has expanded. Net profit, according to the company's financial statements reviewed under applicable financial-reporting rules, grew 25% — a solid number, but notably slower than the top line.
At a glance, the two figures tell very different stories, and the gap between them is the most important analytical detail in this report.
Fundamentals: Revenue Grows Fast, Profit Lags Behind
Revenue is the simplest metric to read. When sales climb 56% year-on-year, it means orders are being booked, delivery volumes are rising, and customers are actually paying. For an industry still in the early stages of electrification, this is a meaningful signal, because the main historical constraint has never been demand but rather production capacity, battery availability, and charging infrastructure.
The profit number, however, requires more careful interpretation. Net profit growth of 25% is well below revenue growth of 56%. In economic terms, this31-percentage-point gap implies that the profit margin — the ratio of net profit to revenue — has compressed. Margin compression, also called margin squeeze, usually happens for identifiable reasons: higher raw-material prices such as nickel, lithium, or steel; a product mix dominated by lower-margin models; heavier spending on research, development, and factory expansion; or rising depreciation as new lines come online. Investors rarely treat a 25% profit increase as alarming on its own, but they rarely celebrate it either, when revenue is expanding at more than twice that pace.
Margin tells you not just how big a business is, but how much of that size actually turns into money for shareholders.
There is also a possibility worth keeping in mind: if the 56% revenue growth refers strictly to the first half of 2026 while the 25% profit growth is measured on a full-year basis, then the second-half profit trajectory is under pressure. Either way, the direction points to the same conclusion — profitability is not keeping pace with sales.
The Positive Side: Structural Demand and a Supportive Policy Backdrop
On the optimistic reading, the growth is well-grounded in fundamentals rather than sentiment. Indonesia's electric-vehicle ecosystem has been driven by a clear policy framework, including incentives tied to local content (TKDN) requirements. Those rules push manufacturers to source components domestically, which structurally benefits companies that have already built local supplier networks. For an electric-bus maker, the addressable market is public transport operators, city governments, mining firms, and corporate fleets — orders that tend to be contracted in large batches and therefore capable of generating big jumps in revenue.
The financing environment also matters. With Bank Indonesia's benchmark rate sitting in a relatively accommodative range through 2025 into 2026, cost of capital for both manufacturers and fleet buyers remains manageable. Banks have gradually rebuilt appetite for green financing, and OJK's supervision of lending standards has encouraged a more disciplined approach to project-based vehicle credit. Under those conditions, revenue growth of 56% year-on-year is easier to sustain than it would be under tight liquidity.
The Cautious Side: Liquidity, Concentration, and Execution Risk
On the cautious side, several things deserve monitoring. First, customer concentration: a revenue base heavily reliant on a handful of fleet operators or government entities is vulnerable to budget timing. A single postponed tender can shift an entire quarter. Second, the profitability gap itself — if margin compression continues, the sector may end up scaling volume without scaling value, and equity value will follow profit, not revenue. Third, liquidity and capital flows: when global interest-rate expectations shift, emerging-market funds can experience capital outflow, and smaller or less liquid names in the industrial sector tend to see thinner trading volumes and wider bid-ask spreads. That can amplify volatility in the share price even when operating data is solid.
Execution risk is the fourth factor. Scaling from dozens to hundreds of units requires consistent quality control, reliable battery warranties, and a dependable after-sales network. Warranty provisions, if under-estimated, can quietly erode margins in later periods — and it is precisely in periods of rapid expansion that such provisions are easiest to understate.
Projection: What to Watch in the Second Half
Several indicators will determine whether the 25% profit growth represents a temporary lag or a lasting trend: the ratio of net profit to revenue in the next reporting period, quarterly order intake, and the portion of revenue generated from higher-value segments such as autonomous shuttles or integrated charging solutions.
The balanced conclusion is this: the fundamental story is genuinely improving in scale, but the market should price in profitability, not just expansion. For long-term-oriented investors, a 56% revenue increase is evidence that the industry is real and gaining traction. The 25% profit increase is a reminder that the gap between building a business and earning a good return on that business remains wide — and closing that gap is what the next several reporting periods will reveal.












Comments (0)